Thursday, July 27, 2017

Can a leading diagonal triangle be a corrective wave?

Can a leading diagonal triangle be a corrective wave?

If so, could the pattern on the COMP (Nasdaq Composite), developed from 04.2010 to 11.2012 (monthly chart here, red numbers), be counted as a wave 2?

In other words, I would like to know if the EW theory allows for a corrective wave 2 to be a leading diagonal that makes higher highs and if this EW count could have any merit?

Sunday, February 16, 2014

Iper-inflation vs deflation, my take

Today I have solved, at least inside myself, the dilemma iper-inflation vs deflation.

Iper-inflation is the building of a lie out of control (debt and entitlements into the system), it feeds on itself and like a lie it brings to more lies to cover up and to mislead from the inconvenient truth (i.e. that the system does not support all its debt and entitlements).

But eventually, the truth is inevitable (it can take years), but the reality cannot be escaped, the system has to reset and the reset mechanism can be pure deflation or induced deflation by war.

Friday, February 14, 2014

The meaning of Trader

Today I have connected two dots.

The words trader and traitor have the same latin root, "tradere" or "to offer".

Have you ever noticed that, the market is the perfect traitor, perfectly able to mislead, change direction, betray expectations, exactly when those same expectations arise to consciusness in the trader?

Wednesday, January 1, 2014

Mission accomplished: the rockets have been propelled to escape velocity


Last night 31.12.12 closing print propelled all 4 major US markets (SPX, DJIA, RUT and NDX), above their 2007 peaks (for SPX, DIJA and RUT, that means also above their previous all-time high), by such a margin that a minimum fib retracement (23.6%), would still be above their previous peaks.

Will the central planners at the FED allow for some weakness now that they might think escape velocity has been achieved?

Wednesday, October 30, 2013

Current up-trend target: SPY 180.1, by 12 November, 2013

My indicators point to the following price/time target: SPY 180.1 (or vicinity), by 12 November 2013 (if today's current opening range low at 177, or vicinity, is not violated).


Thursday, August 15, 2013

Should the dice roll...


Should the dice roll, I have a price/time window target for SPY (red rectangle bottom right).

Saturday, August 3, 2013

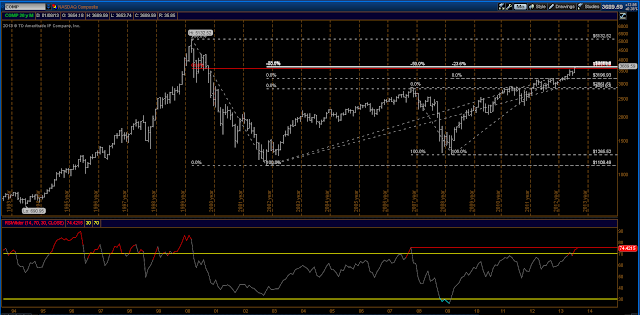
Nasdaq Composite - Multi-year bearish set-up


Major market turns have in the past happened in the oblivious state of summer heats:

August 1921
July 1932
June 1949
August 1982

The Nasdaq Composite chart below, or better, the way I look at it, suggests to me that there is a distinct bearish scenario that has reached or it's about to reach its multi-year gestation.